How safe is the plane you're flying? How safe is the airline?
![]()
I've got a little safety summary of all the aircraft frequently flown around the world, grouped by class:
Large Airliners - Midsize Airliners - Small Airliners - Regional Jets
Itinerary Code = What the aircraft is notated as on itineraries and flight schedules.
![]()
AIRCRAFT:
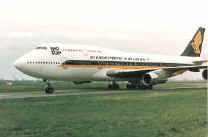
Large Jet Airliners (275+ Seats mixed class configuration)
|
Boeing 747 (-100, -200, -300, -400) Itinerary Code: B747, B744 Seating: 397 - 568 Air Crashes per million flights: 1.55 Rank: 4 out of 4 in class |
|
Boeing 777 Itinerary Code: B777 Seating: 279 Crashes per million: 0* * - The 777 has only been on the market for about a year. Rank: 1 out of 4 (tie) |
|
Airbus 330 Itinerary Code: A330 Seating: 335 Crashes per million: 0 Rank: 1 out of 4 (tie) |
|
Lockheed L1011 Itinerary Code: L1011 Seating: 302 Crashes per million: .91 Rank: 3 out of 4 (tie) |
Midsize Airliners (175 - 274 Seats Mixed Class)
|
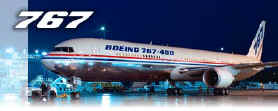
Boeing 767 Itinerary Code: B767, B763, B764 Seating: 224 Crashes per million flights: .46 Rank: 2 out of 7 in class |
|
McDonnel-Douglas (Boeing) MD11 Itinerary Code: M11, MD1 Seating: 248 Crashes per million: 4.29 Rank: 7 out of 7 |
|
Douglas (Boeing) DC10 Itinerary Code: D10, DC1 Seating: 250 Crashes per million: 1.84 Rank: 6 out of 7 |
|
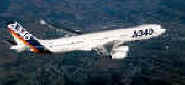
Airbus 340 Itinerary Code: A340 Seating: 250 Crashes per million: 0 Rank: 1 out of 7 |
|
Airbus 300 Itinerary Code: A300 Seating: 266 Crashes per million: .88 Rank: 4 out of 7 |
|
Airbus 310 Itinerary Code: A310 Crashes per million: 1.48 Rank: 5 out of 7 |
|
Boeing 757 Itinerary Code: B757 Seating: 194 Crashes per milliion: .56 Rank: 3 out of 7 |
| Small Airliners |
|
|
Boeing 737 Itinerary Code: B737, 733, 73S, 738 Seating: 125 Crashes per million flights: .71 Rank in Class: 6 out of 7
|
|
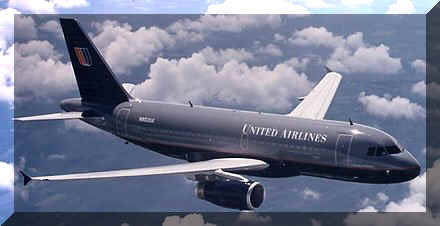
Airbus 320-Series Itinerary Code: A319, A320, A321 Seating: 150 Crashes per million: .67 Rank: 4 out of 7 (tie) |
|
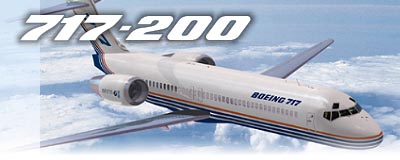
Boeing 717 Itinerary Code: B717 Seating: 100 Crashes per million: 0* *Note: The 717 has been on the market for less than a year. Rank: 1 out of 7 |
|
Boeing 727 Itinerary Code: B727, 72S Seating: 150 Crashes per million: .66 Rank: 3 out of 7 |
|
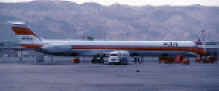
McDonnell-Douglas (Boeing) MD-80 Itinerary Code: M80, MD80, MD8x, MD88 Crashes per million: .35 Rank: 2 out of 7 |
|
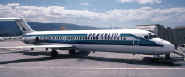
Douglas (Boeing) DC-9 Itinerary Code: DC9, D9S Crashes per million: .76 Rank: 7 out of 7 |
|
Fokker F-100 Itinerary Code: F100, F10 Crashes per million: .67 Rank: 4 out of 7 |
Regional Jets
No crashes have ever occured with the three most popular regional jets (Canadair Regional Jet, Embraer Regional Jet, and British Aerospace 146).
Disclaimer: Please not that the aircraft is not the ONLY factor in determining the safety of your flight. Factors such as pilot error, air rage, and individual airlines' maintenance do play a role. Please read on.
![]()
Crashes by Airline
| Airline | Rate | Crashes | Flights | Last Crash |
|---|---|---|---|---|
| Air Canada | 0.63 | 3 | 4.75M | 1983 |
| AirTran (ValuJet) | 5.88 | 1 | 0.17M | 1996 |
| Alaska Airlines/Horizon Air | 0.49 | 2 | 4.05M | 1976 |
| Aloha Airlines/Aloha IslandAir | 0.49 | 1 | 1.34M | 1989 |
| America West Airlines | 0.00 | 0 | 2.30M | N/A |
| American Airlines/American Eagle | 0.53 | 9 | 17.0M | 1999 |
| American Trans Air | 0.00 | 0 | 0.33M | N/A |
| Canadian Airlines | 0.00 | 0 | 1.90M | N/A |
| Continental Airlines/Continental Express | 0.63 | 5 | 8.0M | 1997 |
| Delta Airlines/Delta Connection | 0.30 | 6 | 20.0M | 1997 |
| Hawaiian Airlines | 0.00 | 0 | 0.33M | N/A |
| Midway Airlines | 0.00 | 0 | 0.08M | N/A |
| Midwest Express | 3.85 | 1 | 0.26M | 1985 |
| Northwest Airlines/Northwest Airlink | 0.43 | 4 | 9.2M | 1993 |
| Reno Air | 0.00 | 0 | 0.22M | N/A |
| Southwest Airlines | 0.00 | 0 | 6.26M | N/A |
| Tower Air | 0.00 | 0 | 0.03M | N/A |
| Trans World Airlines/Trans World Express | 0.74 | 6 | 8.10M | 1996 |
| United Airlines/United Express | 0.50 | 9 | 18.0M | 1997 |
| US Airways/USAir Express | 0.56 | 8 | 14.3M | 1994 |
Latin America and the Caribbean | ||||
| Airline | Rate | Crashes | Flights | Last Crash |
|---|---|---|---|---|
| Aerolineas Argentinas | 1.20 | 2 | 1.67M | 1992 |
| Aeromexico | 1.85 | 4 | 2.16M | 1986 |
| AeroPeru | 16.7 | 2 | 0.12M | 1996 |
| Air Jamaica | 0.00 | 0 | 0.29M | N/A |
| Austral Lineas Aereas | UNK | 4 | UNK | 1997 |
| Avianca | 3.15 | 4 | 1.27M | 1990 |
| BWIA International Airways | 0.00 | 0 | 0.45M | N/A |
| Cubana | 18.2 | 6 | 0.33M | 1998 |
| LAN Chile | 4.0 | 2 | 0.50M | 1991 |
| Mexicana | 0.53 | 1 | 1.90M | 1986 |
| TACA International | 0.00 | 0 | 0.25M | N/A |
| TAESA | 2.86 | 0 | 0.35M | 1999 |
| Transbrasil | 2.35 | 2 | 0.85M | 1980 |
| Transportes Aereos Regionais (TAM) | 8.33 | 5 | 0.60M | 1997 |
| VASP | 3.24 | 6 | 1.85M | 1986 |
| VIASA | 0.00 | 0 | 0.20M | N/A |
| Varig | 1.22 | 3 | 2.45M | 1989 |
Europe | ||||
| Airline | Rate | Crashes | Flights | Last Crash |
|---|---|---|---|---|
| Aer Lingus/Aer Lingus Commuter | 0.00 | 0 | 1.20M | N/A |
| Air France/Air France Europe | 1.02 | 6 | 5.90M | 1998 |
| Air UK | 0.00 | 0 | 0.80M | N/A |
| Airlines of the former Soviet Union | UNK | 17 | UNK | 1997 |
| Alitalia | 0.77 | 3 | 3.90M | 1990 |
| Austrian Airlines | 0.00 | 0 | 0.75M | N/A |
| Braathens | 0.74 | 1 | 1.35M | 1972 |
| British Airways | 0.32 | 2 | 6.35M | 1985 |
| British Midland Airways | 0.97 | 1 | 1.03M | 1989 |
| Finnair | 0.00 | 0 | 1.70M | N/A |
| Iberia | 0.89 | 4 | 4.50M | 1985 |
| Icelandair | 0.00 | 0 | 0.39M | N/A |
| Lufthansa/Condor | 0.41 | 3 | 7.30M | 1993 |
| KLM/KLM Cityhopper | 1.25 | 3 | 2.40M | 1994 |
| Olympic Airways/Olympic Aviation | 1.67 | 3 | 1.80M | 1989 |
| Sabena | 0.00 | 0 | 1.60M | N/A |
| SAS | 0.00 | 0 | 5.40M | N/A |
| Swissair/Crossair | 0.94 | 3 | 3.20M | 1998 |
| TAP Air Portugal | 1.18 | 1 | 0.85M | 1977 |
| THY | 7.3 | 8 | 1.10M | 1994 |
| Virgin Atlantic | 0.00 | 0 | 0.05M | N/A |
Africa and Middle East | ||||
| Airline | Rate | Crashes | Flights | Last Crash |
|---|---|---|---|---|
| Air Afrique | 3.33 | 1 | 0.30M | 1987 |
| Air Zimbabwe | 12.5 | 2 | 0.16M | 1979 |
| EgyptAir/Air Sinai | 8.0 | 6 | 0.75M | 1999 |
| El Al | 0.00 | 0 | 0.34M | N/A |
| Ethiopian Airlines | 4.00 | 2 | 0.50M | 1996 |
| Iran Air | 2.5 | 2 | 0.80M | 1988 |
| Kenya Airways | 0.00 | 0 | 0.22M | N/A |
| Kuwait Airways | 0.00 | 0 | 0.35M | N/A |
| Nigeria Airways | 5.00 | 3 | 0.60M | 1995 |
| Royal Air Maroc | 1.54 | 1 | 0.65M | 1994 |
| Royal Jordanian | 8.82 | 3 | 0.34M | 1979 |
| Saudi Arabian Airlines | 1.40 | 3 | 2.15M | 1996 |
| South African Aiways | 0.63 | 1 | 1.60M | 1987 |
| Tunis Air | 0.00 | 0 | 0.30M | N/A |
Asia and Australasia | ||||
| Airline | Rate | Crashes | Flights | Last Crash |
|---|---|---|---|---|
| Air India | 6.82 | 3 | 0.44M | 1985 |
| Air New Zealand | 0.74 | 1 | 1.35M | 1979 |
| Airlines of the People's Republic of China | UNK | 14 | UNK | 1999 |
| All Nippon Airways | 0.22 | 1 | 4.64M | 1971 |
| Ansett of Australia | 0.00 | 0 | 2.52M | N/A |
| Ansett of New Zealand | UNK | 1 | UNK | 1995 |
| Asiana Airlines | 1.85 | 1 | 0.54M | 1993 |
| Cathay Pacific | 1.45 | 1 | 0.69M | 1972 |
| China Airlines (Taiwan) | 10.0 | 9 | 0.90M | 1999 |
| Garuda Indonesian Airlines | 4.08 | 8 | 1.96M | 1997 |
| Indian Airlines | 4.40 | 11 | 2.50M | 1993 |
| Japan Air Lines | 2.05 | 5 | 2.44M | 1985 |
| Korean Air | 5.38 | 7 | 1.30M | 1997 |
| Malaysia Airlines | 1.11 | 2 | 1.80M | 1995 |
| Pakistan International Airlines | 5.00 | 7 | 1.40M | 1992 |
| Philippine Air Lines | 4.68 | 8 | 1.71M | 1994 |
| Qantas | 0.00 | 0 | 1.02M | N/A |
| Singapore Airlines/SilkAir | 1.00 | 1 | 1.00M | 1997 |
| Thai Airways Company | UNK | 3 | UNK | 1987 |
| Thai Airways International | 1.90 | 2 | 1.05M | 1998 |
![]()
Sources:
Data for airline and aircraft safety: Airsafe Industries and Insurance
Auxiliary source: Foster, Catherine. "Flying Safe on the Skyways: Tracking the Best, Worst." Christian Science Monitor. 26 April 1995, pp. 1+.
Pictures:
Boeing, Delta Air Lines, American Airlines, Airbus
Background photo: Delta Air Lines Lockheed L-1011, photo courtesy Delta Air Lines.
![]()